
Last Updated: May 29, 2026
Interactive maps can be a powerful addition to various business presentations, from sales decks and marketing collateral to company reports.
By bringing geographic data to life, interactive maps can capture your audience’s attention, enhance data visualization, and tell a compelling visual story.
With user-friendly map software like Mapme, building an interactive map is as easy as creating a PowerPoint presentation.
Why Use Interactive Maps in Presentations?
- Engagement: Interactive elements like maps help maintain audience interest and attention better than static visuals alone.
- Data Visualization: Maps can display complex geographical data in an intuitive, easy-to-understand format.
- Customization: Presenters can focus on the specific regions or data points most relevant to their topic.
- Storytelling: An interactive map allows for a narrative journey through different locations or periods.
- Real-time Updates: Interactive maps can display live data, keeping your presentations current and dynamic.
Use Case Examples
- Sales Decks: A construction company can showcase its portfolio of projects on an interactive map, allowing the presenter to highlight the most relevant projects during the presentation and Q&A. Map Example.
- Marketing Collateral: A non-profit organization can boost fundraising by integrating an interactive impact map in their presentations, visually demonstrating the reach and effect of their work. Map Example.
- Company Reports: An interactive map embedded in an annual report can provide an engaging, visual representation of a company’s global reach and performance. Map Example.
How to Integrate Interactive Maps in Presentations
There are two ways to get an interactive map into a presentation. Each has its place:
Live Embed (Interactive Inside the Slide)
The map loads directly inside a slide as a live, interactive element. Viewers can pan, zoom, and click pins without leaving the deck. It sounds impressive, but in practical scenarios it often runs into problems — slow loads, iframe restrictions, authentication prompts, or the embed simply failing to render on the presenter’s machine.
Interactive maps run best in browsers. They’re built for it — full-screen real estate, responsive controls, and a smooth pan-zoom experience. Squeezing that into an embedded frame on a slide usually delivers a compromised version of what the map is capable of. Support for live embeds has also narrowed over the last couple of years, and today only a handful of modern presentation tools handle it cleanly.
Also Check: How to embed your interactive map in your website?
Image with Link (Screenshot + Hyperlink)
You insert a static screenshot of the map into the slide and link it to the live map URL. During the presentation, clicking the image opens the interactive map in a browser in full-screen view. It’s the more dependable choice for a few reasons:
- Works everywhere: PowerPoint, Google Slides, Keynote, PDFs exported from any tool.
- Never fails in a live setting: no iframe to load, no authentication prompt, no “refused to connect” error.
- Holds up offline: the screenshot remains on the slide even if the room Wi-Fi dies.
- Full-screen browser view often looks better than a cramped embed on a slide.
How to get Map URL and Screenshot in Mapme
For most presentation platforms, you’ll need both a map screenshot and a map URL. Here’s how to get them with Mapme:
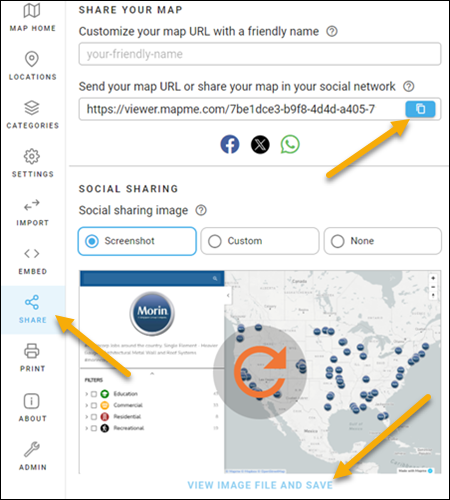
- Map URL: Publish the map and click on “Share” in the sidebar. Use the copy button to get the map URL.
- Screenshot: Mapme automatically generates a social sharing image, which is also great for use in presentations. Update the image with your latest changes, click on the orange arrows, and then click “View Image File and Save” to open the image in a new tab. You can then copy the image URL from the browser bar or save the image to your computer.
Step-by-Step Guide for Adding Interactive Maps to Popular Presentation Tools
Check out our step-by-step guides for integrating interactive maps in popular presentation platforms like PowerPoint, Google Slides, Canva, Gamma, and StoryDoc.
Steps to insert interactive map in PowerPoint (PPT)
Microsoft’s own Web Viewer add-in for PowerPoint was retired on December 2, 2024 and is no longer available. However, a third-party alternative has since emerged. Today you have two options for adding an interactive map to your PowerPoint presentation:
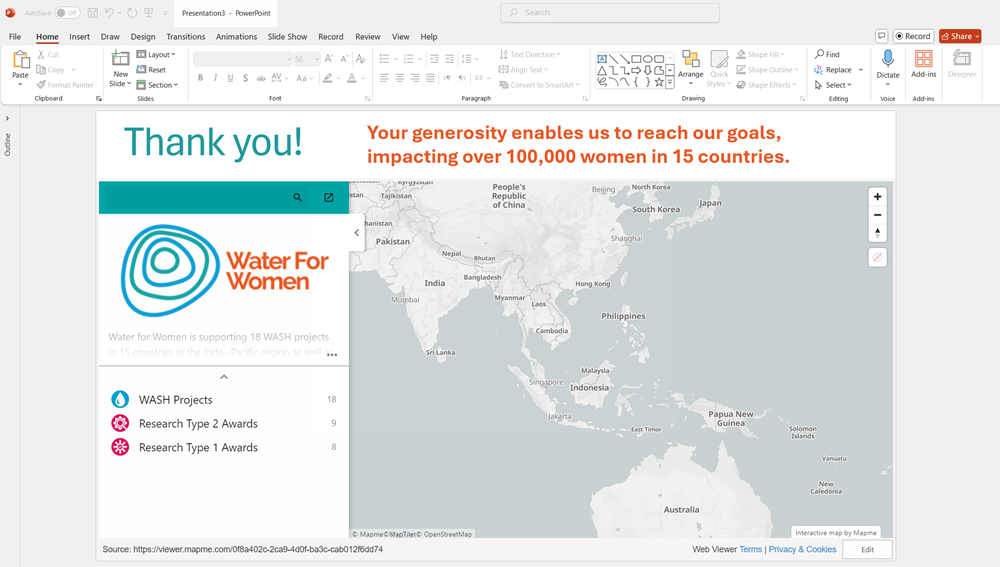
Option 1 – Image with Link (recommended)
- Insert Screenshot: Insert > Pictures > This Device > Choose your screenshot image file.
- Link the Image: Right-click image > Link > Paste map URL.
During the presentation, clicking the image opens the interactive map in a browser. Reliable, works on every version of PowerPoint.
Option 2 – Live Embed with Web Viewer 2.0 (Paid Third-Party Add-in)
If you want a live, interactive map embedded directly inside your PowerPoint slide, Web Viewer 2.0 is a third-party add-in available on the Microsoft AppSource marketplace that fills the gap left by Microsoft’s retired Web Viewer. Note: this is a paid app.
How to set it up:
- In PowerPoint, go to Insert > My Add-ins.
- Search for and install Web Viewer 2.0 (or get it directly from AppSource).
- Once the add-in is active, paste your Mapme map URL into the Web Viewer 2.0 panel.
The map will load as a live embed inside your slide, your audience can pan, zoom, and interact with it during the presentation.
This works similarly to how iframes function on a website, bringing full interactivity into PowerPoint without switching windows.
Steps to insert interactive map in Google Slides
Since Google Slides does not support embedded content, you’ll need to insert a screenshot with a link to the map.
- Insert Screenshot: Insert > Image > By URL > Paste screenshot URL.
- Add Link: Insert > Link > Paste map URL.
Steps to insert interactive map in Canva
Canva’s embed feature doesn’t load the map as a live interactive element — it displays a preview card with the map’s image, title, and description, and clicking it opens the map in a new tab. Functionally, this is the same as the image + link approach, just with Canva generating the preview for you.
- Embed Map: Click “Embed” from the menu > Paste map URL > Add to design.
- Adjust Size: Resize the preview card on the page as needed.
Alternatively, you can insert your own Mapme screenshot (Insert > Uploads) and add the map URL as a link on the image for more control over how it looks on the slide.
Steps to insert interactive map in Gamma
Gamma supports live web embeds natively, so your Mapme map stays fully interactive inside the slide. The setup takes two quick steps:
Step 1 – Insert the Webpage Block
- In a Gamma card, type `/` (slash) to open the insert menu.
- Select “Webpage or App” from the content block options.
- Paste your Mapme map URL. A preview embed will appear, showing the map’s image, title, description, and link — similar to a social media share card.
Step 2 – Switch to Live Embed
- Hover over the preview embed — a link display menu will appear.
- Click the “Link display” dropdown and select “Embed”.
- The preview card is replaced with a fully embedded, interactive map directly inside your card.
When you run the presentation, clicking on the map opens it in a window within Gamma rather than sending viewers off to the Mapme website in a separate browser tab. Your audience can explore the full interactive map without ever leaving the deck.
Steps to insert interactive map in StoryDoc
- Add an Embed Block: Add an “Embed” or “Custom Embed” block to the desired section.
- Get the Embed Code: Copy the interactive map embed code
- Paste the Code: Insert the embed code into the embed block in Storydoc.
- Adjust and Save: Adjust settings if needed, then save and preview your presentation.
- Publish: Once satisfied, publish or share your presentation.
Note: Storydoc’s custom embed block is a paid-plan feature. On the free or starter tier this option isn’t available — you’ll need to be on a paid plan to embed external content like a Mapme map.
Get Started Today
Ready to bring your presentations to life with interactive maps? Sign up for a free 14-day trial of Mapme and let our customer success team guide you through the process.
Frequently Asked Questions
1. What are the key benefits of using interactive maps in presentations?
Interactive maps enhance engagement by allowing users to explore data dynamically. They help visualize trends, create immersive storytelling, and make presentations memorable.
2. Do I need advanced technical skills to create an interactive map?
Not at all! Mapping tools like Mapme are designed for users of all skill levels with drag-and-drop tools and ready-to-use templates.
3. What content can I add to my interactive map presentations?
You can include images, videos, audio clips, text descriptions, and links to enrich the user experience and effectively communicate your message.
4. Can interactive maps be easily integrated into popular presentation platforms?
Yes, interactive maps can be integrated into platforms like PowerPoint, Google Slides, and Gamma. Depending on the platform, this is done via a screenshot with a hyperlink, a live embed, or a third-party add-ins